
Cement plants run continuously. Unlike batch chemical sites where windows open and close, your electrical economics accrue every shift: raw and finish mills, material handling, compressors, WHR export, grid draw in time-of-use bands.
Large units also stack multiple power sources HT grid, waste heat recovery, solar or open access, sometimes captive each with different effective ₹/kWh. The "right" mix is not a one-time project decision. It is a recurring operational choice that shift teams make under production pressure.
On top of that, cement culture already accepts energy discipline:
ISO 50001 EnMS with significant energy uses and opportunity registers
PAT-aligned SEC baselines and corporate intensity reporting
Plant EMS or power monitoring with kWh/ton trends
That maturity is exactly why another trend chart disappoints. Leadership does not lack data. It lacks assigned decisions with owners, rupee stakes, and bill verification on the loads EMS was never designed to close.
Three levers that move your cement electricity bill
These are the highest-value decision zones for continuous-process cement without touching kiln DCS or production risk on clinker.
1. Power dispatch across grid, WHR, and RE
When several sources are available, shift teams often default to the safe, familiar mix not the lowest-rupee mix for that hour and tariff window.
Enterprise cement cases show that small per-unit dispatch errors, repeated across thousands of operating hours, can compound into multi-crore annual exposure on large integrated stacks. Mid-market and regional plants face the same logic at smaller scale: the habit problem is identical even when the rupee total is different.
Governed decision: Document who sets source priority for peak windows, what evidence they use, and what ₹ impact last week's pattern implied.
2. Contract demand and coordinated starts
Crushers, raw mills, and finish mills restarting together after an outage or maintenance window are a classic MD breach pattern. The penalty line appears on the bill; the coordination failure happened days earlier.
Governed decision: Staggered restart plan with a named owner electrical plus production not a post-mortem note in the monthly review.
3. SEC drift on grinding and auxiliaries
National electrical SEC averages ~74 kWh/ton cement; best plants approach ~56 kWh/ton . Drift of even 5–10% on finish grinding or auxiliaries is often a maintenance or scheduling signal, not a mystery to stare at on a dashboard until month-end.
On a 1 MTPA line, 1 kWh/ton is roughly 1 GWh per year material at typical industrial tariffs.
Governed decision: When SEC moves against baseline, assign inspection or schedule adjustment with expected ₹/month impact not another EnPI chart in the register.
The meeting that repeats when decisions stay informal
Picture a typical monthly review at an advanced plant:
The energy manager presents kWh/ton versus baseline. Dispatch is described as "generally fine." An EnMS opportunity from Q2 remains open. Finance asks why the HT bill rose when production tonnage was flat. Sustainability asks which operational actions supported the intensity trend in the corporate pack.
Nobody can point to a closed loop: decision → owner → execution → verified rupee outcome.
That meeting is not a people problem. It is a system design problem. EMS and EnMS were built to observe and register. They were not built to assign, track, and reconcile to DISCOM line items every billing cycle.
What verified recovery looks like in rupees
Cement units in the ₹50 lakh to ₹2 crore per month HT band should treat electricity as a margin lever, not a fixed overhead. Reference benchmarks on comparable process-intensive plants in India suggest 12–20% cost recovery when dispatch, MD, and SEC drift decisions are systematically owned and verified. That is an exploration band - not a guarantee until your plant's bills prove it.
Illustrative annual impact (₹75 lakh monthly HT spend)
Verified recovery | Monthly | Annual |
|---|---|---|
10% | ₹7.5 lakh | ₹90 lakh |
15% | ₹11.25 lakh | ₹1.35 crore |
20% | ₹15 lakh | ₹1.8 crore |
Plants with multi-source stacks, recurring MD risk, and measurable SEC drift on electrical loads often land toward the upper half of the band once prescriptions cover dispatch windows, stagger plans, and auxiliary response—not only incomer totals.
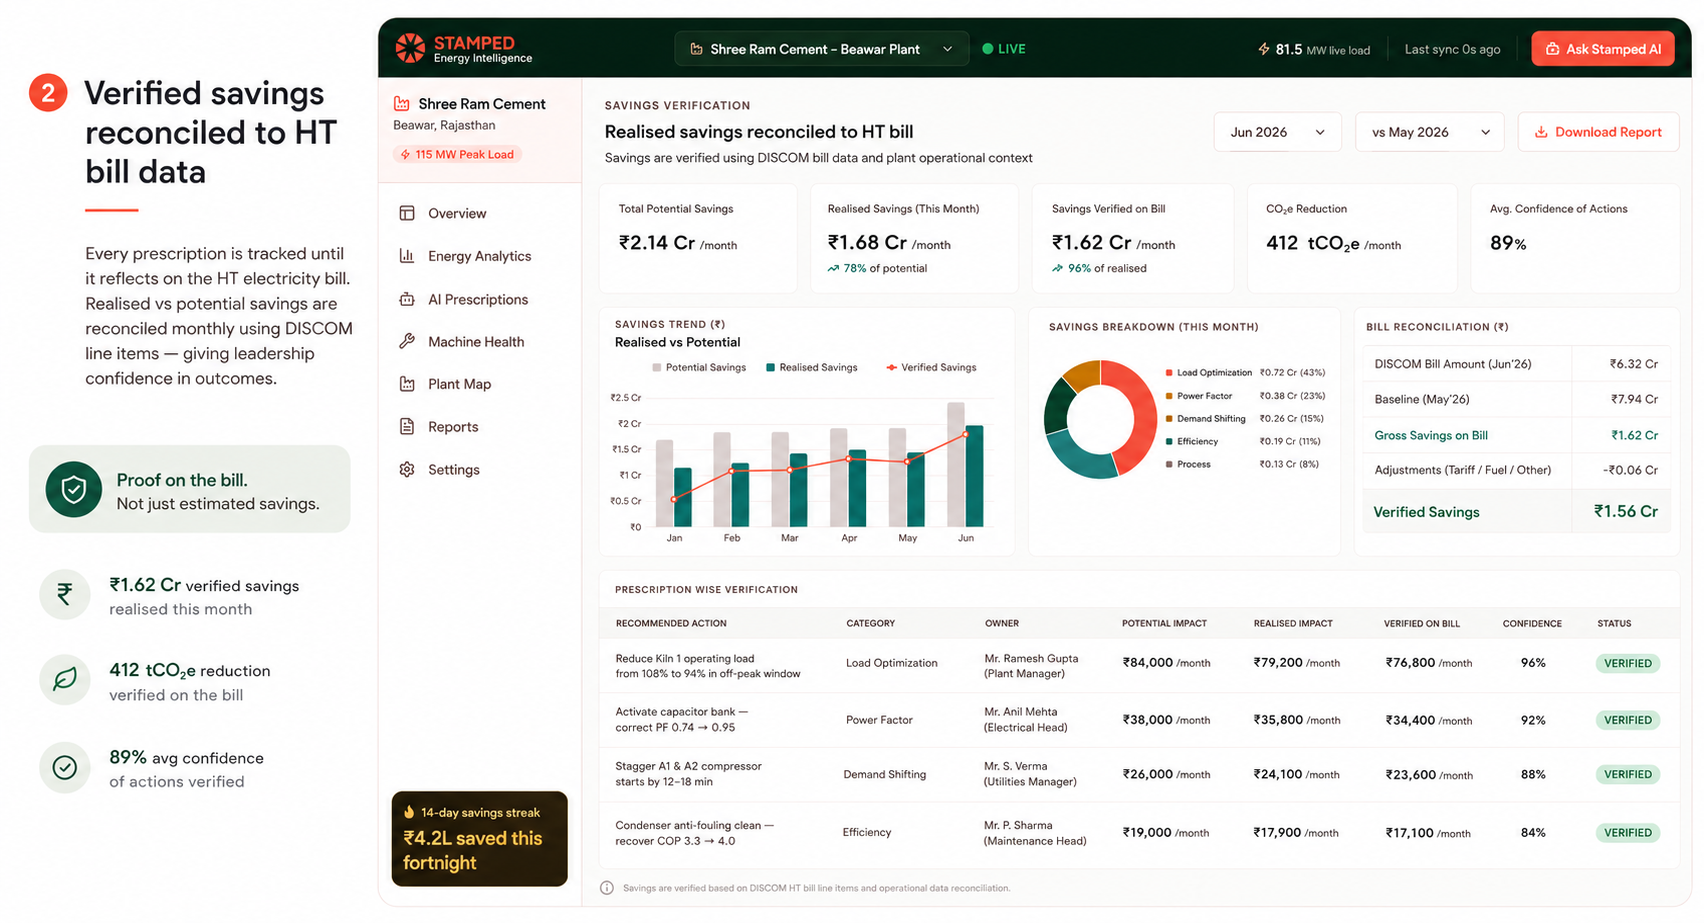
Verified savings reconciled to HT bill data on the Stamped dashboard
The credibility test is simple: Can finance tie the savings story to bill line items? If not, it stays engineering narrative.
PAT, intensity, and one operational ledger
Margin pressure and PAT or carbon intensity expectations converge at plant level on the same metrics: grid kWh, kWh/ton, and documented actions.
Capex-WHR upgrades, solar PPAs, efficient mill drives matters. It does not explain why this month drifted relative to last month when dispatch habits and auxiliary SEC moved.
A governed loop gives corporate and sustainability teams something audits accept: realised vs potential savings, intensity trend where tonnage is tagged, and a trail of who changed what operationally not only project milestones in a slide deck.
That is operational sustainability in practice: less wasted grid power, defensible intensity improvement, and evidence that survives a management review.
Closing the loop without touching the kiln
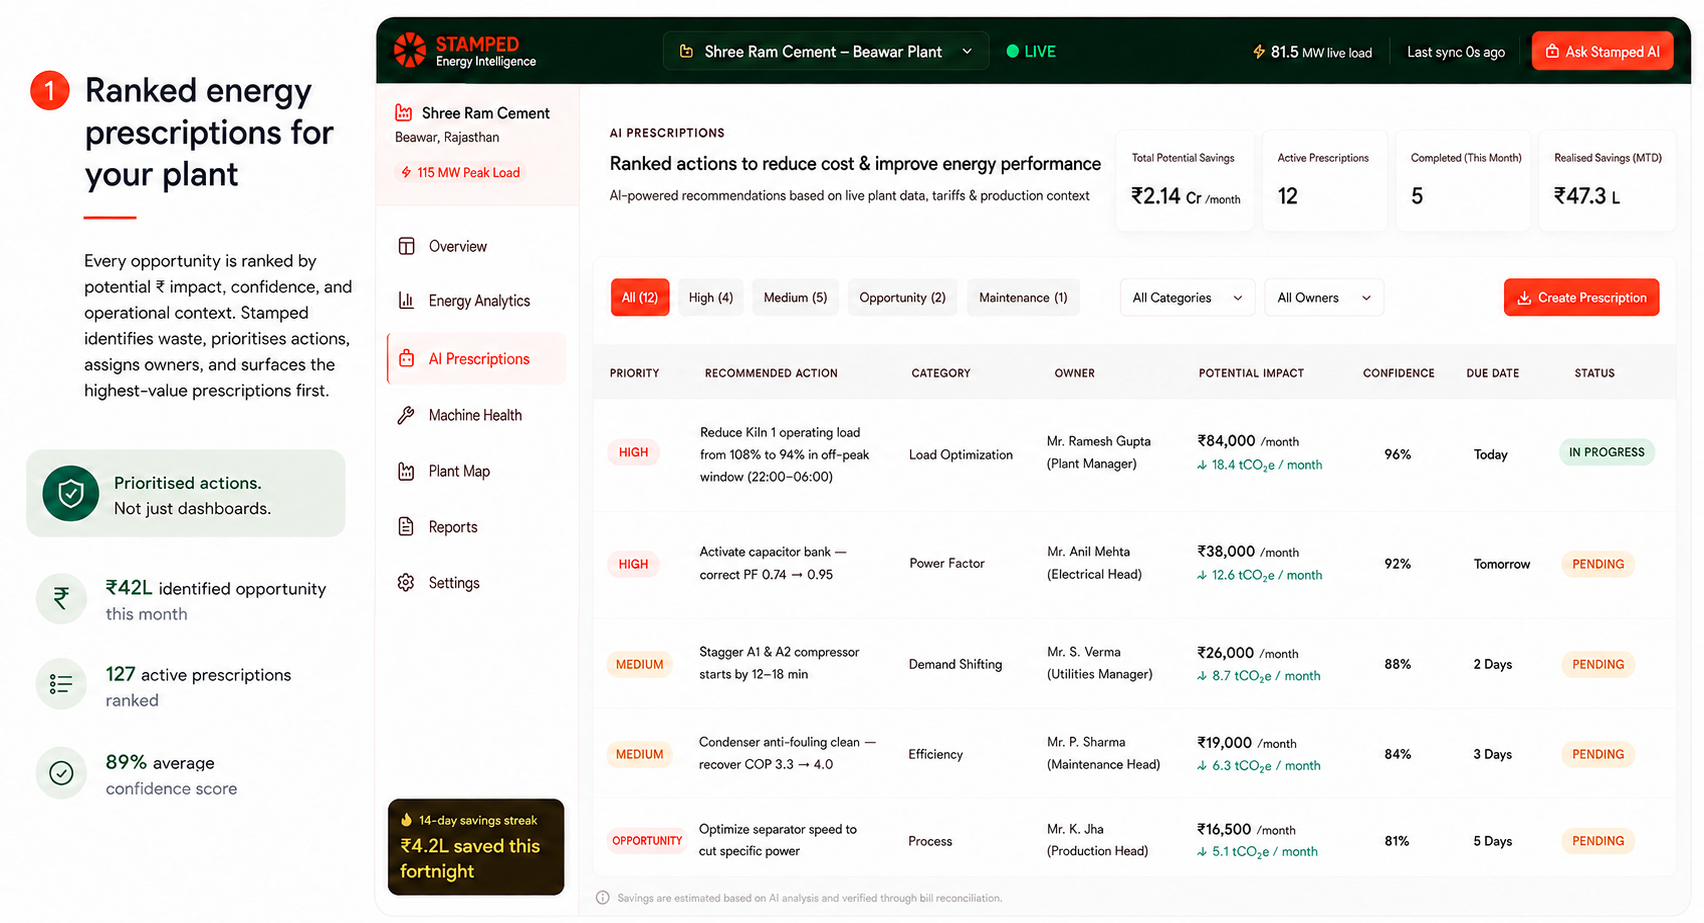
Stamped Energy is prescriptive energy intelligence for energy-intensive manufacturing in India. We sit above your existing EMS and EnMS - read-only on meters, bills, and optional SCADA feeds—and govern the gap between insight and verified outcome.
Stage | What happens in cement context |
|---|---|
Connect | HT bills, incomer data, production/tonnage where available |
Observe | SEC drift, MD patterns, dispatch windows vs tariff |
Decide | Ranked prescriptions with ₹ impact—not alarms |
Execute | Owners in electrical, production, maintenance |
Verify | Next billing cycle; ledger for leadership and PAT evidence |
We do not write to kiln DCS or bypass your change-control process. We focus on mills, auxiliaries, compressors, MD, and dispatch—the levers plant leadership can govern without clinker risk.
Learn more on our cement industry page or read how verification works.
Five questions for your next management review
Use these to stress-test whether your current stack closes the loop:
Who owned dispatch decisions in last week's peak tariff window—and what did we expect them to save?
When SEC drifted against baseline, what action was assigned before month-end?
After the last outage, was mill restart staggered by plan or by habit?
Can finance reconcile last month's savings narrative to DISCOM line items?
Does sustainability reporting tie to verified operational actions, or only to capex projects?
If two or more answers are unclear, the problem is not missing sensors. It is missing governance between the scorecard and the referee.
Where to start
Upload your last three HT electricity bills. Map the three levers - dispatch, MD coordination, SEC drift on electrical loads against your current EMS and EnMS setup. If the numbers justify a pilot, run a 90-day governed loop with bill verification before any kiln-adjacent integration conversation.
Book a discovery call - we will review your bills and outline what a cement-specific prescription queue would look like on your data.