Data is abundant. Clear priorities are not.
The signals are already sitting in your machines, control systems, meters and registers, but turning them into a clear next action takes more time than anyone on the floor has.
Stamped builds models of your plant from the data it already records, finds where efficiency is lost across process, quality, planning and maintenance, and improves it with actions your team can take.


Example actions
The signals are already sitting in your machines, control systems, meters and registers, but turning them into a clear next action takes more time than anyone on the floor has.
When rejections go up, the dashboard shows the number, but it rarely tells you whether the cause was the night-shift restarts, a die running cold or a batch that waited too long for heat treatment, and working that out is the hard part.
Choices like running harder, delaying maintenance or changing the sequence all affect output, quality and cost, yet the rejection, the breakdown or the extra energy tends to surface days later, when it is too late to rethink the call.
Stamped helps plants cut rejections, get more output from the lines they already have, and use less energy in every good part. It brings data from separate systems into one view, builds a model of how your plant actually runs and turns hidden losses into specific actions for the person who can fix them. It is a self-improving agentic system, so it gets better with every result.
Stamped recommends and your team decides, and every change is checked against your own baseline.
Stamped works with the systems your plant already runs, so there is nothing new to install before we start.
Stamped works with the systems your plant already runs, so there is nothing new to install before we start.
Models trained on your plant's own history learn how it runs, where its control can improve and which conditions come before a rejection, a stoppage or wasted energy.
On WhatsApp or on screen, ranked by what it is costing you and explained well enough to judge.
Your team decides. Every change is measured against your own baseline, and the models retrain on what it shows, so Stamped keeps getting better.
Fewer rejections reach the customer, because lots at risk are caught in real time, while they can still be saved.
More output from the same lines, with control, restarts and pacing improved beyond your best runs.
Fewer surprise breakdowns, since slow drift shows up in data you already collect.
Less energy for every good part, once idle heat, reheats and scrap are counted and brought down.
The first finding usually comes within about two weeks. Results are measured against your own baseline and published only with your permission.
Improve your control policies instead of only repeating your best runs, with better settings, control rules and restart routines recommended to your engineers.
Learn moreLink process data to every lot, get an alert while a lot can still be saved, and have each lot's record ready when the auditor or the customer asks.
Learn moreWhen the plan breaks, get a re-plan that accounts for the whole plant, along with what each option would do to output and delivery.
Learn morePrescriptive maintenance that says what to fix and when, ranked by what each stop costs and planned around your production.
Learn moreEnergy is counted in all four.
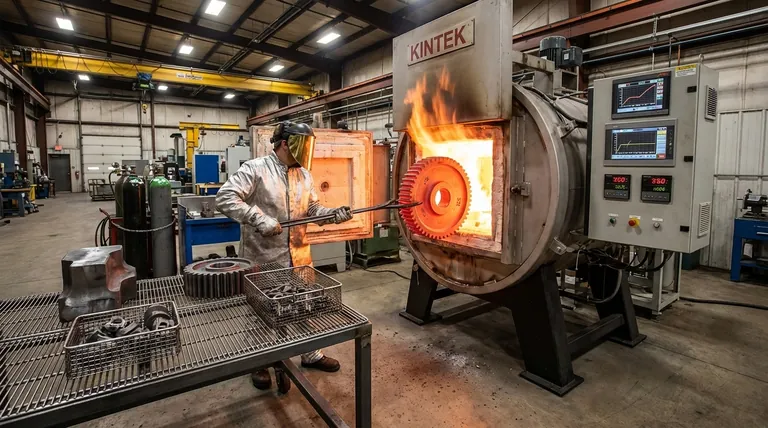
A forge, a melt shop and a kiln look nothing alike, but each one loses efficiency in process, quality, planning and maintenance. Stamped learns the signals that matter in each plant from its own history.
Stamped connects to the systems already in your plant and learns how it actually runs. It finds where efficiency is lost across process, quality, planning and maintenance, improves control, alerts your team in real time while a lot can still be saved, and sends ranked actions to the people who can act on them, then checks the results against your own baseline.
No hardware retrofit is needed to get started, because Stamped is software that works with the systems you already run. It is not another MES or CMMS: your MES, ERP and SCADA are where the data comes from, and Stamped works alongside them.
Stamped recommends and your team decides. Your senior supervisors usually know the plant well, and Stamped is built to back them up: it looks at every line on every shift, including the shifts they are not on, and writes down what it finds with the reasoning, so the night shift gets the same advice the day shift gets from your best hands.
Yes. Stamped is a self-improving agentic system. It learns from every action your team accepts, adjusts or turns down, and from the ones it chose to hold back, and its models are retrained on your plant's data as it runs. Each improvement is tested on past shifts before your team approves it, so the advice gets sharper every week.
We sign an NDA before the site survey, and during the survey and the pilot we work only with the data your team agrees to share. You can ask us anything about where it is kept and who can see it before anything is connected.
Each action goes on WhatsApp or on screen to the supervisor, engineer or maintenance lead who already owns that work, so nobody has to learn a new system before they can act on one, and nothing sits on a screen that only the plant head opens once a month. During the site survey we need some hours with your plant head and your quality and maintenance leads, planned around production.
We start with a site survey, which means a few days on your floor and a written read-out of where efficiency is being lost and what we would change first. If it makes sense, that is followed by a paid pilot on one line for eight to twelve weeks, and the first finding usually comes within about two weeks.
We don't publish prices, because they depend on the plant. During the site survey we agree only the price of the pilot, once we know which line and which problem it will cover. The pilot is a paid engagement of 8 to 12 weeks, priced on its own and not tied to an annual contract value, and the annual contract price is decided afterwards, based on the results of the pilot.
Yes. Most plants keep some registers on paper or in Excel, and the site survey tells you plainly whether what you already record is enough to start on one line, and what would be worth recording if it is not.
Spend a few days with us on your floor, and we'll give you a written read-out of where efficiency is being lost and what we would do first.
There is nothing new to install to start, and Stamped recommends and your team decides.