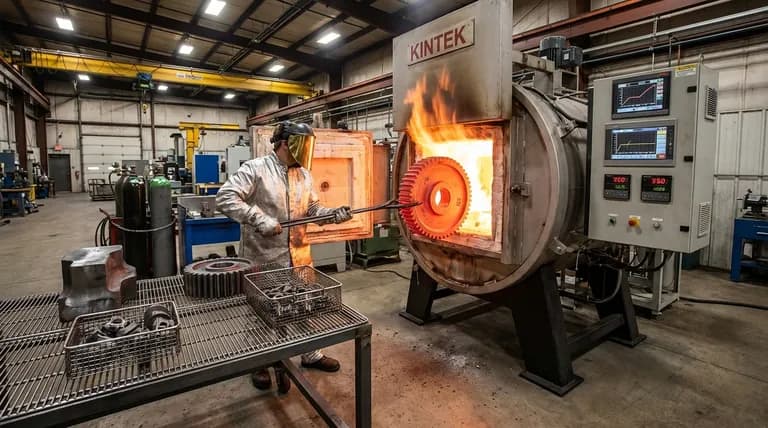
Holding temperature with nothing to hold
Friday, 18:00. The last batch clears quench. Production schedule shows no Saturday batches. The furnace stays at soak anyway, because Monday must not start cold.
Saturday and Sunday pass. Registers hold. Exhaust stacks run. Nobody receives a work order tied to the production calendar.
Monday, finance does not see "weekend habit" on the bill. They see energy units and demand on the DISCOM statement.
Heat treatment shops run batch furnaces like insurance policies: keep temperature through the weekend so Monday does not start from cold. The logic is sound until you line it up against the confirmed batch schedule.
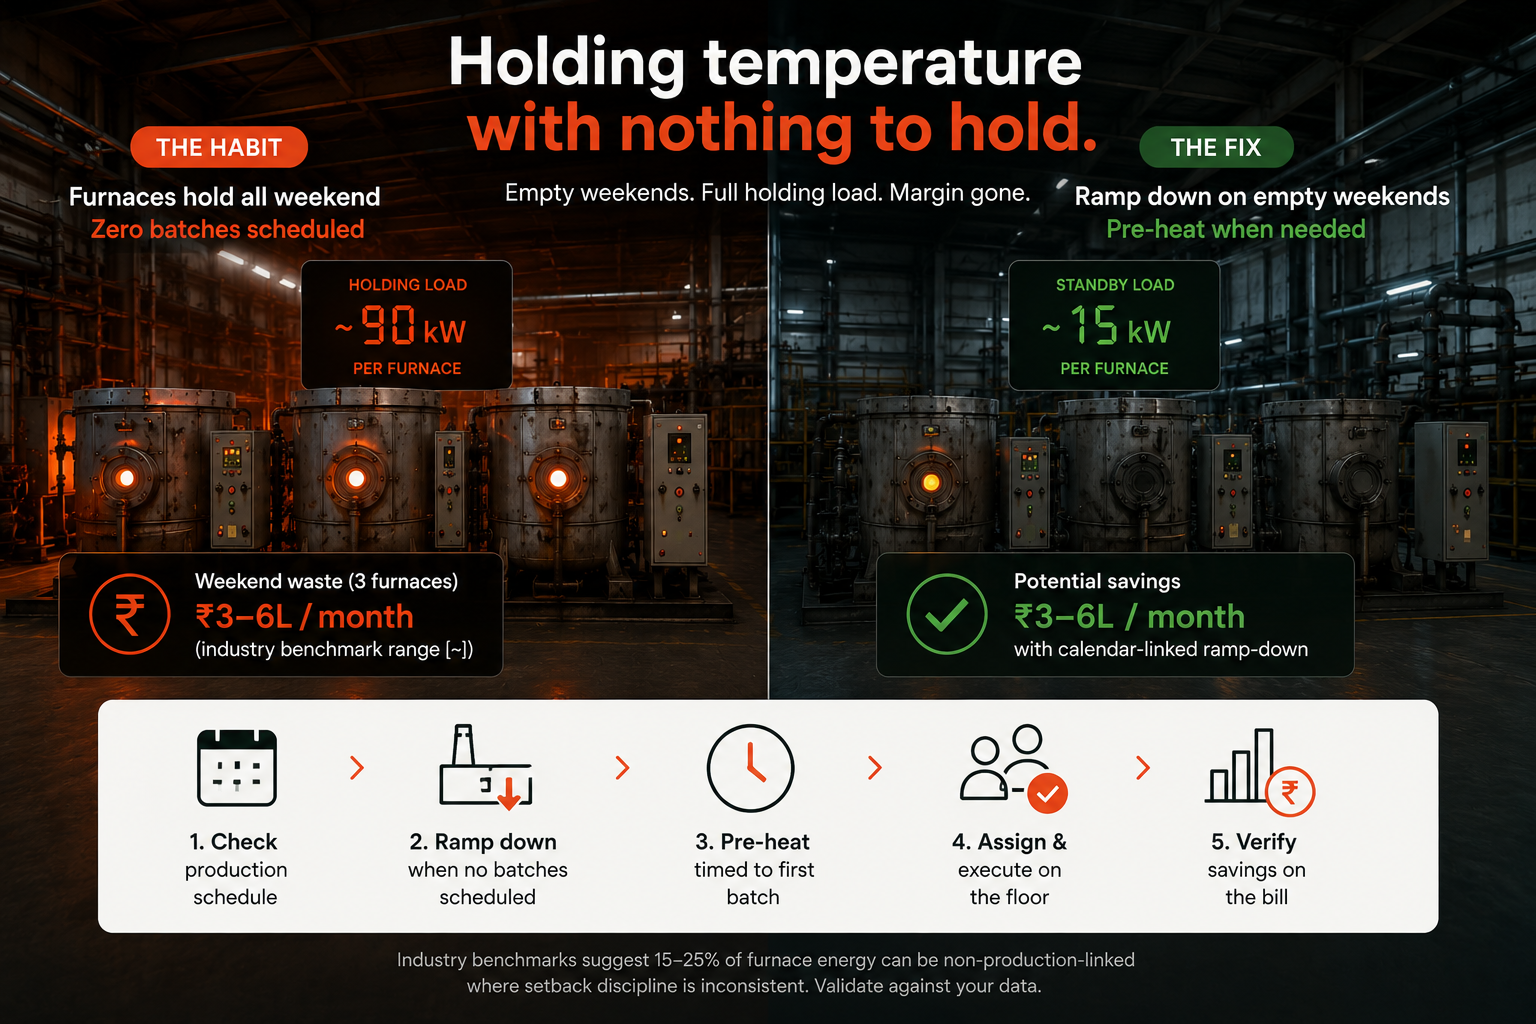
In plants we have baselined, 40% of weekends had zero batches scheduled, yet furnaces maintained full holding load for 48+ hours (observation from comparable batch HT shops; validate against your MES or production log). That is not maintenance energy. That is margin walking out the exhaust.
The rupee math
Furnace holding is not free. For a typical batch shop with three sealed-quench or batch furnaces:
Input | Typical range | Notes |
|---|---|---|
Holding load per furnace | 60–120 kW | Soak + circulation + ancillaries |
Weekend hours without batches | 36–48 hours | Fri evening to Mon pre-heat |
Blended industrial tariff | ₹8–12/kWh | HT band; validate your DISCOM rate |
Monthly waste (3 furnaces) | ₹3–6L | When holding runs on empty weekends |
Benchmarks also suggest 15–25% of furnace energy can be non-production-linked where weekend setback discipline is inconsistent (industry reference range, not a guarantee for your site).
That number does not always spike maximum demand. It always hits the energy units line. Over a year, it is a cost line the CFO can quantify if you tie furnace registers to the production calendar.
Why the habit persists
Three reasons weekend hold survives every cost review:
Monday risk — "We cannot afford a four-hour re-heat" is the default objection
Fixed clocks — pre-heat starts at 06:00 because it always has, not because the first batch is at 08:30
Siloed data — SCADA sees temperature; production planning sees batches; nobody owns calendar-linked energy
Your HT SCADA does its job. It holds soak. It does not read next week's dispatch list and ask whether Friday's hold is still justified.
EMS shows kWh trending flat over the weekend. It rarely outputs: "Ramp down Furnace 2 by Sunday 18:00 — zero batches confirmed — save ₹85,000 this month."
Safe ramp-down: calendar-linked prescriptions
The objection is always Monday morning. The answer is not "run cold all weekend." It is prescriptions tied to confirmed schedules:
Correlate furnace registers with confirmed batch schedules 36 hours out (MES, ERP export, or supervisor sheet)
Ramp down when no batches are scheduled before Sunday 18:00 (threshold agreed with HT lead)
Pre-heat Monday timed to first confirmed batch, not a fixed 06:00 clock
Assign owner — HT operator + shift electrical supervisor
Verify — non-production furnace kWh week-over-week; energy units line on next bill
Plants that adopt this pattern often see ~60% reduction in weekend holding hours without missing Monday dispatches (industry benchmark from shops that implemented calendar-linked setback; your ramp curves and alloy rules may differ).
Prescription shape that changes behaviour:
> Furnace 3: No batches scheduled Sat–Sun per production plan #4471. Ramp to standby at 19:00 Friday. Pre-heat from 05:30 Monday for 07:00 batch start. Estimated ₹72,000–95,000/month vs full weekend hold. Owner: HT shift lead. Verify: furnace kWh Sat–Mon vs prior four empty weekends.
That is actionable. A kWh dashboard is not.
Worked example: empty weekend, full hold
Situation: Three batch furnaces at Binola-class HT shop. Production schedule confirms no Saturday or Sunday loads by Thursday 16:00. All three furnaces remain at soak from Friday 20:00 through Sunday 23:59. First batch Monday 07:30.
SCADA view: Temperature stable. Alarms quiet.
Stamped prescription (illustrative):
Field | Example |
|---|---|
What | Furnaces 1 and 2 to standby Sunday 18:00; Furnace 3 holds for Mon 07:30 batch only |
Why | 4 of last 5 empty weekends showed 90+ kW holding load with zero batch IDs in MES |
Who | HT operator + electrical supervisor |
Effort | SOP update; no capex |
Impact | ₹1.2–2.0L/month furnace energy (benchmark range; pilot calibrates) |
Verify | Weekend furnace kWh vs same-week production volume; bill energy units line |
The production calendar already knew it was waste. The energy layer should have said so on Friday.
Verify on the bill
Plant heads need a number finance will believe. Practical approach:
Step | Method |
|---|---|
Baseline | Non-production furnace kWh for weekends with zero batches (4–8 week window) |
Action | Execute calendar-linked ramp-down prescriptions |
Compare | Same calendar weeks prior year, adjusted for production volume (IPMVP-style |
Reconcile | Energy units and, where relevant, MD line items on DISCOM bill |
Stamped Energy maintains a running ₹ ledger: potential vs realized savings reconciled to bill line items, not estimated project slides.
Read-only integration first: incomer meter, HT SCADA tags, utility bills, production signals where available. No furnace control writes in phase one.
See the full loop on How It Works.
What to check this week
You can sanity-check the hypothesis before any software rollout:
Pull last 8 weekends from production schedule: how many had zero confirmed batches?
For those weekends, pull furnace kWh or kW hold from SCADA or sub-meter
Note Monday pre-heat start time vs first actual batch time
Multiply hold kW × empty hours × your blended rate
If more than one-third of weekends run full hold with no batches, benchmarks suggest ₹3–6L/month may be in play for a three-furnace shop at typical HT tariffs [~]. Your data replaces the range.
How Stamped closes the loop
Layer | What you likely have today | What Stamped adds |
|---|---|---|
Data | HT SCADA, incomer meter, bill PDF, MES/schedule export | Furnace state aligned to batch calendar |
Insight | Temperature trends, shift notes | Non-production kWh flagged with ₹/month |
Action | Tribal "we always hold" rules | Prescriptions with owner, ramp window, effort |
Proof | Estimated conservation projects | Verified ₹ on bill energy units line |
For the HT shop manager: Monday dispatch protected by batch-timed pre-heat, not blind hold.
For the CFO: Weekend waste quantified and tracked, not debated in quarterly review.
For the electrical head: read-only SCADA and meter integration; no controller writes in pilot.
Bottom line
Weekend furnace holding is a habit, not a requirement. Your production calendar already knows when no parts are scheduled. Your energy layer should turn that into assigned ramp-downs with ₹ on the ticket and proof on the next bill.
Industry benchmarks put 15–25% of furnace energy and ₹3–6L/month at risk where empty weekends still run full soak (typical three-furnace batch shop, HT tariff band [~]). Calendar-linked prescriptions can cut weekend holding hours sharply without missing Monday dispatches.
Quantify empty weekends first. Prescribe ramp windows second. Verify on the bill third.
Book a discovery call — we review your last three bills, weekend SCADA pattern, and whether a single-plant pilot is justified. If the numbers do not support it, we say so.