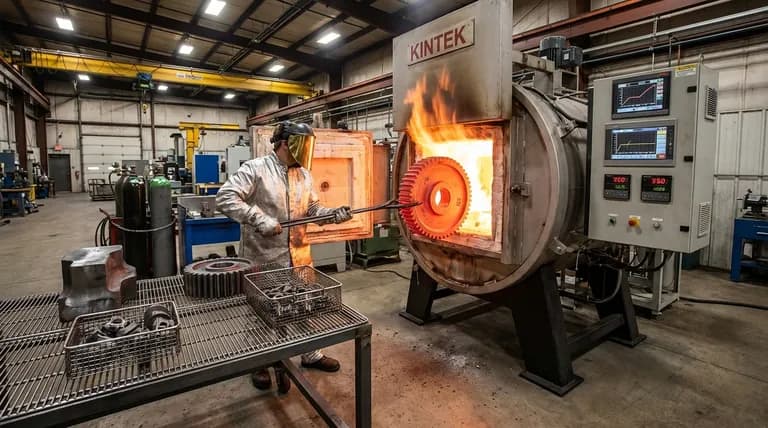
The invisible morning spike
06:45. Holding furnaces ramp. Compressors kick in. Quench pumps come online. The incomer meter climbs before the first pour.
Your EMS logs the kVA peak. Finance sees it again on the DISCOM bill as maximum demand charges. Between those two moments, nobody gets a work order: what overlapped, who staggers it, how many rupees per month.
Every die casting plant knows this rhythm. What plant heads rarely quantify is how much of the spike is avoidable overlap, not production demand.
That gap is where margin leaks. On many HT industrial tariffs in India, MD charges can run 30–50% of the monthly bill (industry benchmark). A predictable morning window you can sequence away is not an operations nuisance. It is a cost line.
What the data shows
Across automotive-adjacent die casting units in India, 15–22% of billed maximum demand often traces to the first 30–40 minutes of shift start (industry benchmark, not a plant-specific guarantee). The pattern repeats:
Three holding furnaces pre-heating simultaneously
Compressors running before moulds are staged
Quench and utility loads starting on a fixed clock, not the production schedule
The spike is not random. It is scheduled overlap dressed as startup discipline.
Signal | What it usually means | Benchmark impact |
|---|---|---|
Incomer kW peaks before first pour | Furnace + utility ramp ahead of production | MD charge holds all month |
Overlap window 20+ min daily | Multiple assets on fixed timers | ₹4–8L/month at typical HT tariff bands |
Holding load flat with zero pours scheduled | Furnace hold without batch | Non-production kWh, often 10–20% of furnace load |
Compressor hours before MES signal | Air system ahead of need | Adds to shift-start MD stack |
These are reference ranges from comparable die casting loads. Your incomer interval data and bill line items replace benchmarks with your numbers.
Why dashboards miss it
Most EMS platforms answer what happened at 06:52 kVA. They rarely answer:
Which furnace started how many minutes before the first pour
Whether compressor run hours matched any scheduled production signal
What the MD ₹ line item would look like if Furnace 2 started 10 minutes later
kWh trends do not change shift behaviour. Prescriptions in rupees do.
> Stagger Furnace 2 pre-heat by 10 minutes vs Furnace 1 on Mon/Wed/Fri. Estimated ₹1.0–1.5L/month in demand charges. Owner: shift supervisor. Effort: schedule change only. Verify: MD kVA and MD ₹ on next billing cycle.
That is the unit of action that closes the loop. Not a chart. A ticket with a name and a bill line to reconcile.
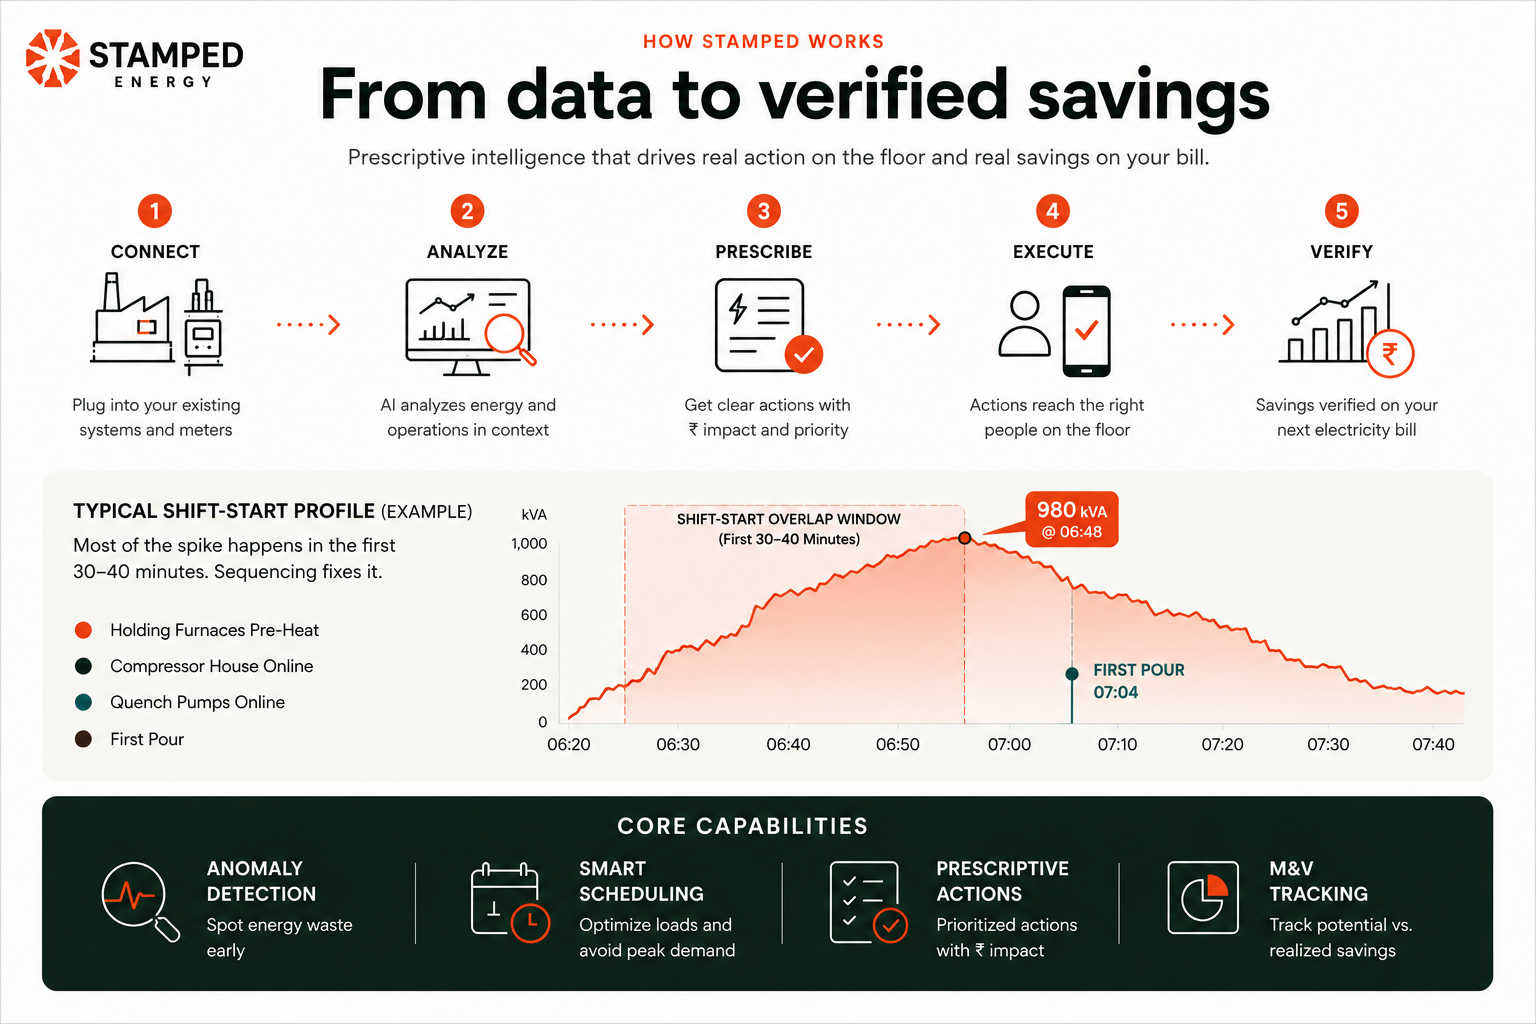
From observation to prescription
The fix is usually not a capital project. It is sequencing:
Map ramp curves against actual pour timestamps from MES, machine logs, or manual shift records
Stagger pre-heat windows by 8–12 minutes per furnace so incomer steps up in stages, not one wall
Alert supervisors when holding load exceeds baseline with zero scheduled pours in the next window
Assign and track the change (who shifted which furnace, which shifts, which days)
Verify on the bill — compare MD kVA and MD ₹ against the same production band as the prior month
Stamped Energy runs this loop on data you likely already have: incomer meter, furnace SCADA or panel data, utility bills, and production signals where available. Read-only integration first. No furnace control writes in phase one.
See the five-step flow on How It Works.
Worked example: three-furnace overlap at shift change
Situation: Incomer hits 980 kVA at 06:48 Tuesday. Holding Furnaces 1, 2, and 3 all entered pre-heat between 06:35 and 06:40. Compressor house online at 06:36. First pour logged at 07:04.
EMS view: kVA peak logged. Alarm maybe cleared. No prescribed sequence change.
Stamped prescription (illustrative):
Field | Example |
|---|---|
What | Delay Furnace 2 pre-heat start by 10 minutes vs Furnace 1 on Tue/Thu/Sat day shift |
Why | 6 of last 8 Tuesdays show kVA above CMD between 06:40–07:00; three-furnace ramp overlap before first pour |
Who | Shift supervisor + furnace operator |
Effort | Schedule change only. Zero capex. |
Impact | ₹1.0–1.5L/month demand charge component (industry benchmark range; pilot calibrates) |
Verify | MD kVA and MD ₹ line vs prior month at similar pour volume |
The pattern is predictable. The fix is operational. The proof is on the bill.
Holding loads: the quiet second spike
Shift-start gets attention because the incomer jumps visibly. Holding is the slower leak:
Furnace at soak with no mould staged
Metal held at temperature between runs while ancillary loads stay fully on
Quench and utility circuits running on shift clock, not pour clock
Benchmarks suggest 15–25% of furnace-related energy in some die casting shops can be non-production-linked where setback discipline is inconsistent [~]. That does not always spike MD. It always hits the energy units line.
Prescription shape is the same: tie energy state to production state, quantify ₹/week, assign an owner, verify after the action.
What to measure next week
You do not need a full platform rollout to sanity-check the hypothesis. Pull these for one week:
Metric | How | Why |
|---|---|---|
Incomer kW/kVA | 15-minute intervals, first hour of each shift | See peak timing vs production |
Furnace ramp start | SCADA tag or operator log timestamp | Compare to first pour |
First pour time | MES, machine counter, or shift log | Defines true production start |
Compressor run hours | Panel meter or CA kWh sub-feed if available | Holding before staging |
Scheduled pours | Production plan or supervisor sheet | Separates hold from run |
Simple threshold: if furnace and utility overlap exceeds 20 minutes daily before the first production signal, industry benchmarks suggest ₹4–8L/month may be recoverable at typical HT industrial tariff bands [~]. Validate against your CMD, tariff, and actual interval data.
How Stamped closes the loop
Layer | What you likely have today | What Stamped adds |
|---|---|---|
Data | Incomer meter, furnace panels/SCADA, bill PDF | Time-aligned view: pour timing, kW, tariff cost |
Insight | EMS trends, shift notes | Overlap attributed to assets, quantified in ₹/month |
Action | Tribal sequencing knowledge | Prescriptions with owner, effort, ₹; WhatsApp to supervisors |
Proof | Estimated savings | Potential vs realized ₹ reconciled to DISCOM line items |
For the plant head: shift-start becomes a weekly discipline with completion tracking, not a quarterly slide.
For the CFO: a savings ledger tied to bill line items, not kWh charts.
For the electrical team: read-only Modbus/OPC-UA/MQTT to meters and SCADA. Integration path in weeks when data already exists.
Bottom line
Shift-start is not background noise on the incomer chart. It is a margin lever hiding in overlap: furnaces, compressors, and utility loads ramping together on a fixed clock while pours start later.
Quantify the window in minutes. Stagger in minutes. Prove it in rupees on the MD line of your next bill. Industry benchmarks put 15–22% of billed MD and ₹4–8L/month in play at typical die casting loads when overlap runs long daily [~]. Your interval data and one billing cycle replace benchmarks with facts.
Book a discovery call - we review your last three bills, shift-start interval pattern, and whether a single-plant pilot is justified. If the numbers do not support it, we say so.